
Want more housing market stories from Lance Lambert’s ResiClub in your inbox? Subscribe to the ResiClub newsletter.
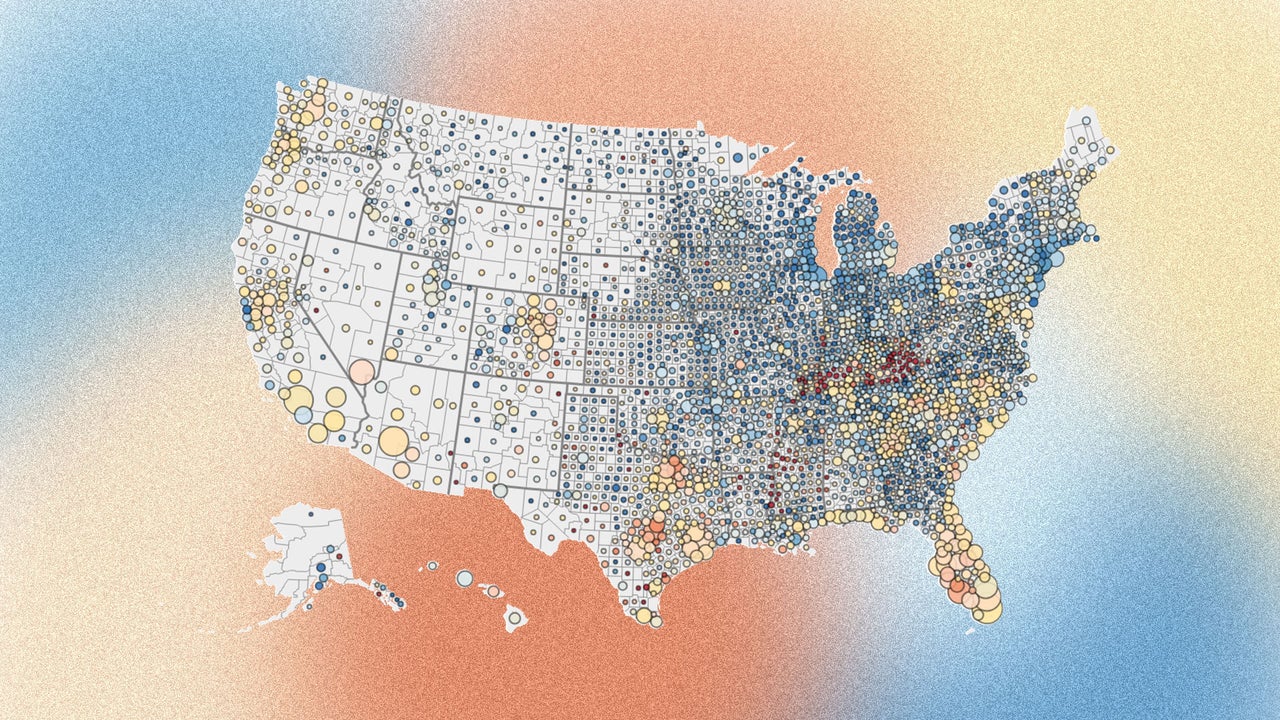
When we make county-level home price maps at ResiClub, we usually shade each county by its result. That works, but it has a blind spot: It treats every county the same, no matter how many homes are in it. Out West, in particular, huge counties with very little housing end up dominating the map visually, while small, densely populated counties back East are hard to see.
So for today’s piece, we tried something different. We took three of our favorite home price cuts and drew each county as a circle sized by its active housing inventory for sale in September 2026. Circle size serves as a rough proxy for market size, and it also shows where homes are sitting on the market for sale right now.
Year-over-year home price shift, by county
This cut below compares each county’s aggregate home prices now to its own peak in 2022. Red means the county is still below that peak, and blue means it has climbed past it.
(function(){function e(){window.addEventListener(`message`,function(e){if(e.data[`datawrapper-height`]!==void 0){var t=document.querySelectorAll(`iframe`);for(var n in e.data[`datawrapper-height`])for(var r=0,i;i=t[r];r++)if(i.contentWindow===e.source){var a=e.data[`datawrapper-height`][n]+`px`;i.style.height=a}}})}e()})();
Shift in home prices since their 2022 peak, by county
(function(){function e(){window.addEventListener(`message`,function(e){if(e.data[`datawrapper-height`]!==void 0){var t=document.querySelectorAll(`iframe`);for(var n in e.data[`datawrapper-height`])for(var r=0,i;i=t[r];r++)if(i.contentWindow===e.source){var a=e.data[`datawrapper-height`][n]+`px`;i.style.height=a}}})}e()})();
Zooming out to the start of the pandemic housing boom, nearly every county remains well above its March 2020 level. Darker circles mark counties with the largest cumulative/remaining gains.
Shift in home prices since March 2020, by county
(function(){function e(){window.addEventListener(`message`,function(e){if(e.data[`datawrapper-height`]!==void 0){var t=document.querySelectorAll(`iframe`);for(var n in e.data[`datawrapper-height`])for(var r=0,i;i=t[r];r++)if(i.contentWindow===e.source){var a=e.data[`datawrapper-height`][n]+`px`;i.style.height=a}}})}e()})();
During the pandemic housing boom, from mid-2020 to mid-2022, there was greater overheating in many growth markets in the Sunbelt, in places like Austin, Texas, and Tampa and Cape Coral, Florida. That greater run-up in home pricing, which further stretched local incomes relative to home prices, is the primary reason those markets were more vulnerable to falling nominal home prices once the boom ended.
Of course, it just took enough of a supply-demand equilibrium shift to manifest that downside risk. That came, in part, through the fact that those Sunbelt markets are more supply elastic: As the positive demand shock drove up home prices and rents during the boom, investor capital and builders poured in.
Once the affordability environment shifted, the single-family and multifamily supply coming online had to see net effective home price cuts/affordability adjustments to move it, which created additional softening for those Sunbelt markets.
Additionally, many of those same markets had seen a greater jump in net domestic migration during the pandemic boom—once the affordability environment shifted, state-to-state migration slowed, forcing growth markets to rely more on their local income base rather than higher-income people moving in. And once the international migration wave let up, that caused additional cooling.
Midwestern markets largely told the opposite story. During the pandemic housing boom, almost every Midwestern market saw less than the national average level of appreciation. Midwestern home prices still rose sharply—just not like in markets like Austin and Cape Coral. That meant local home prices in the Midwest weren’t as stretched relative to local incomes, making it easier to stomach the rate shock.
Additionally, the Midwest has largely seen lower levels of homebuilding than the Sunbelt, so the positive demand shock during the boom didn’t trigger as strong a positive supply shock—meaning fewer homebuilders needed to make big affordability adjustments to maintain volume.
The other factor, of course, is that as state-to-state migration cooled once switching costs spiked in mid-2022, many Midwestern markets benefited from seeing fewer of their residents move to places like Florida or Texas—and a couple of pockets in the Midwest even benefited from additional migration, as relative affordability there was attractive.
Over the past four years, as home prices have been weaker in the Sunbelt—with some markets even passing through material corrections—while Midwestern home price appreciation has remained relatively more resilient, this has translated into “overvaluation,” according to Moody’s Analytics’ model, falling notably across many parts of the Sunbelt, while during the same time, some parts of the Midwest have seen mild upticks in “overvaluation.”