
Close Menu
    Facebook X (Twitter) Instagram
    TRENDING :
    • Can Apple keep its AirPods from becoming ‘PervertPods’?
    • Florida Trend’s Friday Afternoon Update: What You Need to Know
    • Why Leaders Blame Culture Instead of Their Own Behavior
    • Rockford Auburn Falls in Tough Loss – How to Watch Next
    • I’ve Mentored People for 20 Years. I Use These 4 Steps to Help Them Advance
    • Dorman Cheerleaders Hype Up Northwestern Showdown on Palmetto Sports
    • When Growth Stalls, I Don’t Spend More on Marketing. I Reset the Business
    • Trump Taps Katie Zacharia as Press Secretary
    Populist Bulletin
    • Home
    • US Politics
    • World Politics
    • Economy
    • Business
    • Headline News
    Populist Bulletin
    Home»Business»The current housing market bifurcation, as told by one metric
    Business 4 Mins Read

    The current housing market bifurcation, as told by one metric

    Business 4 Mins Read
    Share Facebook Twitter Pinterest LinkedIn Tumblr Telegram Email Copy Link
    Follow Us
    Google News Flipboard
    Share
    Facebook Twitter LinkedIn Pinterest Email


    Want more housing market stories from Lance Lambert’s ResiClub in your inbox? Subscribe to the ResiClub newsletter.

    One of the ways I’ve been tracking shifts in the supply-demand equilibrium of local housing markets for years is by monitoring changes in active inventory/months of supply. If active listings begin to rise rapidly while homes remain on the market longer, it may indicate pricing softness or weakness. Conversely, a sharp decline in active listings/months of supply could suggest a market that is heating/tightening up.

    Since the national Pandemic Housing Boom fizzled out and mortgage rates spiked in summer 2022, directionally, that supply-demand equilibrium has been shifting in the favor of buyers. Indeed, while decelerating, national active inventory for sale is still up +8.1% year-over-year—and now active inventory for sale is only -13.6% below pre-pandemic 2019 levels.

    Broadly speaking, the reason isn’t that there are significantly more new listings. Instead, it’s that, relatively speaking, sellers in the post-Pandemic Housing Boom period are finding more resistance. As a result, homes are spending more time on the market and are therefore being counted as inventory for longer.

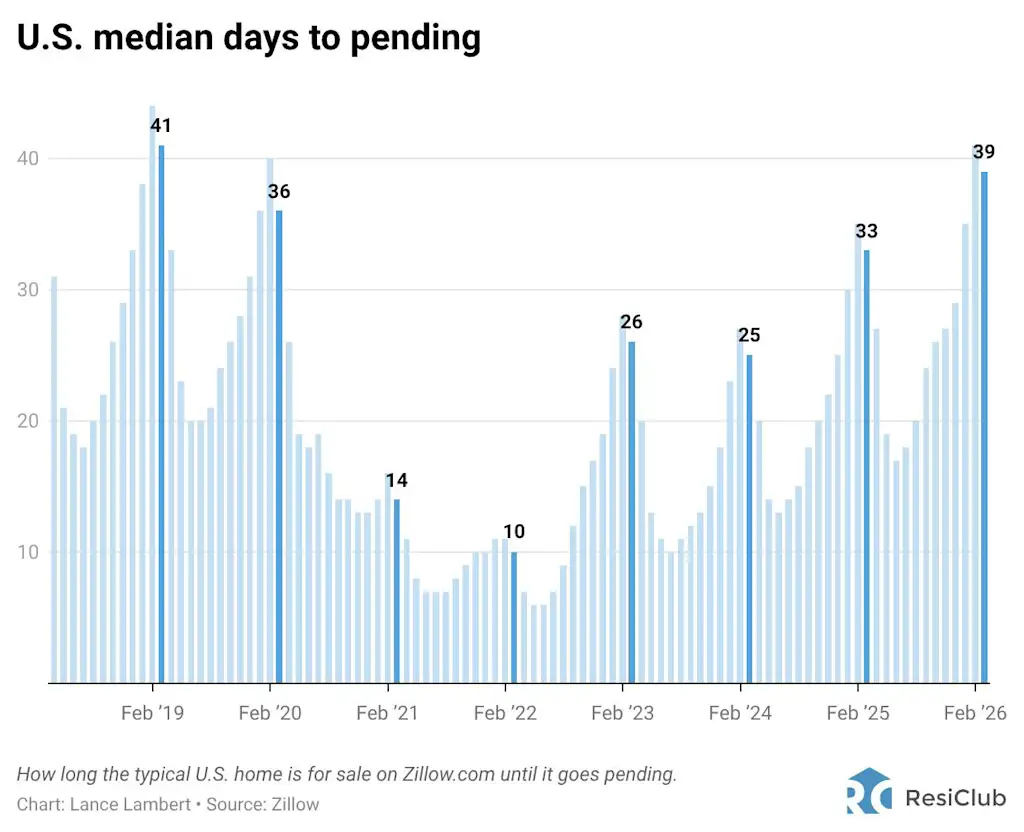
    How long the typical U.S. home listed for sale on Zillow.com before it went pending:

    • Spring 2019 —> 41 days
    • Spring 2020 —> 36 days
    • Spring 2021 —> 14 days
    • Spring 2022 —> 10 days
    • Spring 2023 —> 26 days
    • Spring 2024 —> 25 days
    • Spring 2025 —> 33 days
    • Spring 2026 —> 39 days

    Active housing inventory for sale = All properties for sale in a given month, excluding pending listings. If homes take longer to sell, and begin to rollover into the next month, it begins to build active inventory for sale even if new listings coming onto the market don’t spike. That’s exactly what many housing markets have been experiencing.

    In other words, it’s no coincidence that both the national median days to pending and the national active housing inventory for sale are just about back to pre-pandemic 2019 levels—to a degree, they’re interconnected.

    Of course, this story varies a lot across the country right now.

    The softer/weaker housing market pockets in the Southwest and Southeast have seen median days to pending rise more than in their relatively tighter peer markets in the Northeast and Midwest.

    Among the nation’s 250 largest metro area housing markets, these 15 markets had the highest median days to pending in February 2026:

    1. Asheville, NC —> 105 days
    2. McAllen, TX —> 86 days
    3. Laredo, TX —> 83 days
    4. Houma, LA  —> 83 days
    5. Austin, TX  —> 82 days
    6. Daphne, AL —> 81 days
    7. Longview, TX  —> 78 days
    8. Lake Charles, LA  —> 78 days
    9. Crestview, FL  —> 77 days
    10. Panama City, FL  —> 77 days
    11. San Antonio, TX  —> 74 days
    12. Myrtle Beach, SC  —> 72 days
    13. Killeen, TX  —> 71 days
    14. Ocala, FL —> 71 days
    15. Naples, FL  —>  69 days

    Among the nation’s 250 largest metro area housing markets, these 15 markets had the lowest median days to pending in February 2026:

    1. Lancaster, PA —> 9 days
    2. Hartford, CT —> 11 days
    3. Rochester, NY —> 11 days
    4. Reading, PA —> 11 days
    5. Manchester, NH —> 11 days
    6. Springfield, IL  —> 11 days
    7. Norwich, CT  —> 12 days
    8. Rockford, IL  —> 13 days
    9. Syracuse, NY  —> 15 days
    10. York, PA  —> 15 days
    11. St. Louis, MO  —> 16 days
    12. San Jose, CA  —> 16 days
    13. Allentown, PA  —> 16 days
    14. Bridgeport, CT  —> 17 days
    15. New Haven, CT  —> 17 days

    window.addEventListener(“message”,function(a){if(void 0!==a.data[“datawrapper-height”]){var e=document.querySelectorAll(“iframe”);for(var t in a.data[“datawrapper-height”])for(var r,i=0;r=e[i];i++)if(r.contentWindow===a.source){var d=a.data[“datawrapper-height”][t]+”px”;r.style.height=d}}});


    Source link

    Share. Facebook Twitter Pinterest LinkedIn Tumblr Email

    Related Posts

    Can Apple keep its AirPods from becoming ‘PervertPods’?

    October 10, 2026

    Why Leaders Blame Culture Instead of Their Own Behavior

    October 10, 2026

    I’ve Mentored People for 20 Years. I Use These 4 Steps to Help Them Advance

    October 10, 2026
    Top News
    Business 4 Mins Read

    Stop waiting for perfect AI

    Business 4 Mins Read

    Experts have compressed their predictions for when artificial general intelligence (AGI)—the type of AI that…

    What I learned by vibe-coding my own word processor

    April 17, 2026

    5 Essential Steps to Make Payroll Hassle-Free

    February 22, 2026

    Wall Street remains near record levels as AI frenzy keeps tech stocks climbing

    October 6, 2025
    Top Trending
    Business 6 Mins Read

    Can Apple keep its AirPods from becoming ‘PervertPods’?

    Business 6 Mins Read

    Apple’s AirPods are arguably the most iconic headphones ever. The small, glossy,…

    World Politics 1 Min Read

    Florida Trend’s Friday Afternoon Update: What You Need to Know

    World Politics 1 Min Read

    Florida Trend’s Friday afternoon update rounds up the latest business and political…

    Business 7 Mins Read

    Why Leaders Blame Culture Instead of Their Own Behavior

    Business 7 Mins Read

    Opinions expressed by Entrepreneur contributors are their own. Key Takeaways Leaders tend…

    Categories
    • Business
    • Economy
    • Headline News
    • Top News
    • US Politics
    • World Politics
    About us

    The Populist Bulletin was founded with a fervent commitment to inform, inspire, empower and spark meaningful conversations about the economy, business, politics, government accountability, globalization, and the preservation of American cultural heritage.

    We are devoted to delivering straightforward, unfiltered, compelling, relatable stories that resonate with the majority of the American public, while boldly challenging false mainstream narratives that seem to only serve entrenched elitists, and foreign interests.

    Top Picks

    Can Apple keep its AirPods from becoming ‘PervertPods’?

    October 10, 2026

    Florida Trend’s Friday Afternoon Update: What You Need to Know

    October 10, 2026

    Why Leaders Blame Culture Instead of Their Own Behavior

    October 10, 2026
    Categories
    • Business
    • Economy
    • Headline News
    • Top News
    • US Politics
    • World Politics
    Copyright © 2025 Populist Bulletin. All Rights Reserved.

    Type above and press Enter to search. Press Esc to cancel.