
Want more housing market stories from Lance Lambert’s ResiClub in your inbox? Subscribe to the ResiClub newsletter.
Based on our analysis of the Zillow Home Value Index, U.S. home prices are up just +0.8% year-over-year between March 2025 and March 2026. That marks a deceleration from the +1.2% growth rate a year earlier—though national year-over-year home price growth has recently stabilized, ticking a tad higher from a low of -0.01% in August 2025.
In the first half of 2025, the number of major metro area housing markets seeing year-over-year declines climbed. That count has since stopped ticking up.
- 31 of the nation’s 300 largest housing markets (i.e., 10% of markets) had a falling year-over-year reading in the Jan. 2024 to Jan. 2025 window.
- 42 of the nation’s 300 largest housing markets (i.e., 14% of markets) had a falling year-over-year reading in the Feb. 2024 to Feb. 2025 window.
- 60 of the nation’s 300 largest housing markets (i.e., 20% of markets) had a falling year-over-year reading in the March 2024 to March 2025 window.
- 80 of the nation’s 300 largest housing markets (i.e., 27% of markets) had a falling year-over-year reading in the April 2024 to April 2025 window.
- 96 of the nation’s 300 largest housing markets (i.e., 32% of markets) had a falling year-over-year reading in the May 2024 to May 2025 window.
- 110 of the nation’s 300 largest housing markets (i.e., 36% of markets) had a falling year-over-year reading in the June 2024 to June 2025 window.
- 105 of the nation’s 300 largest housing markets (i.e., 36% of markets) had a falling year-over-year reading in the July 2024 to July 2025 window.
- 109 of the nation’s 300 largest housing markets (i.e., 35% of markets) had a falling year-over-year reading in the Aug. 2024 to Aug. 2025 window.
- 105 of the nation’s 300 largest housing markets (i.e., 35% of markets) had a falling year-over-year reading in the Sept. 2024 to Sept. 2025 window.
- 105 of the nation’s 300 largest housing markets (i.e., 35% of markets) had a falling year-over-year reading in the Oct. 2024 to Oct. 2025 window.
- 98 of the nation’s 300 largest housing markets (i.e., 33% of markets) had a falling year-over-year reading in the Nov. 2024 to Nov. 2025 window.
- 106 of the nation’s 300 largest housing markets (i.e., 35% of markets) had a falling year-over-year reading in the Dec. 2024 to Dec. 2025 window.
- 100 of the nation’s 300 largest housing markets (i.e., 33% of markets) had a falling year-over-year reading in the Jan. 2025 to Jan. 2026 window.
- 99 of the nation’s 300 largest housing markets (i.e., 33% of markets) had a falling year-over-year reading in the Feb. 2025 to Feb. 2026 window.
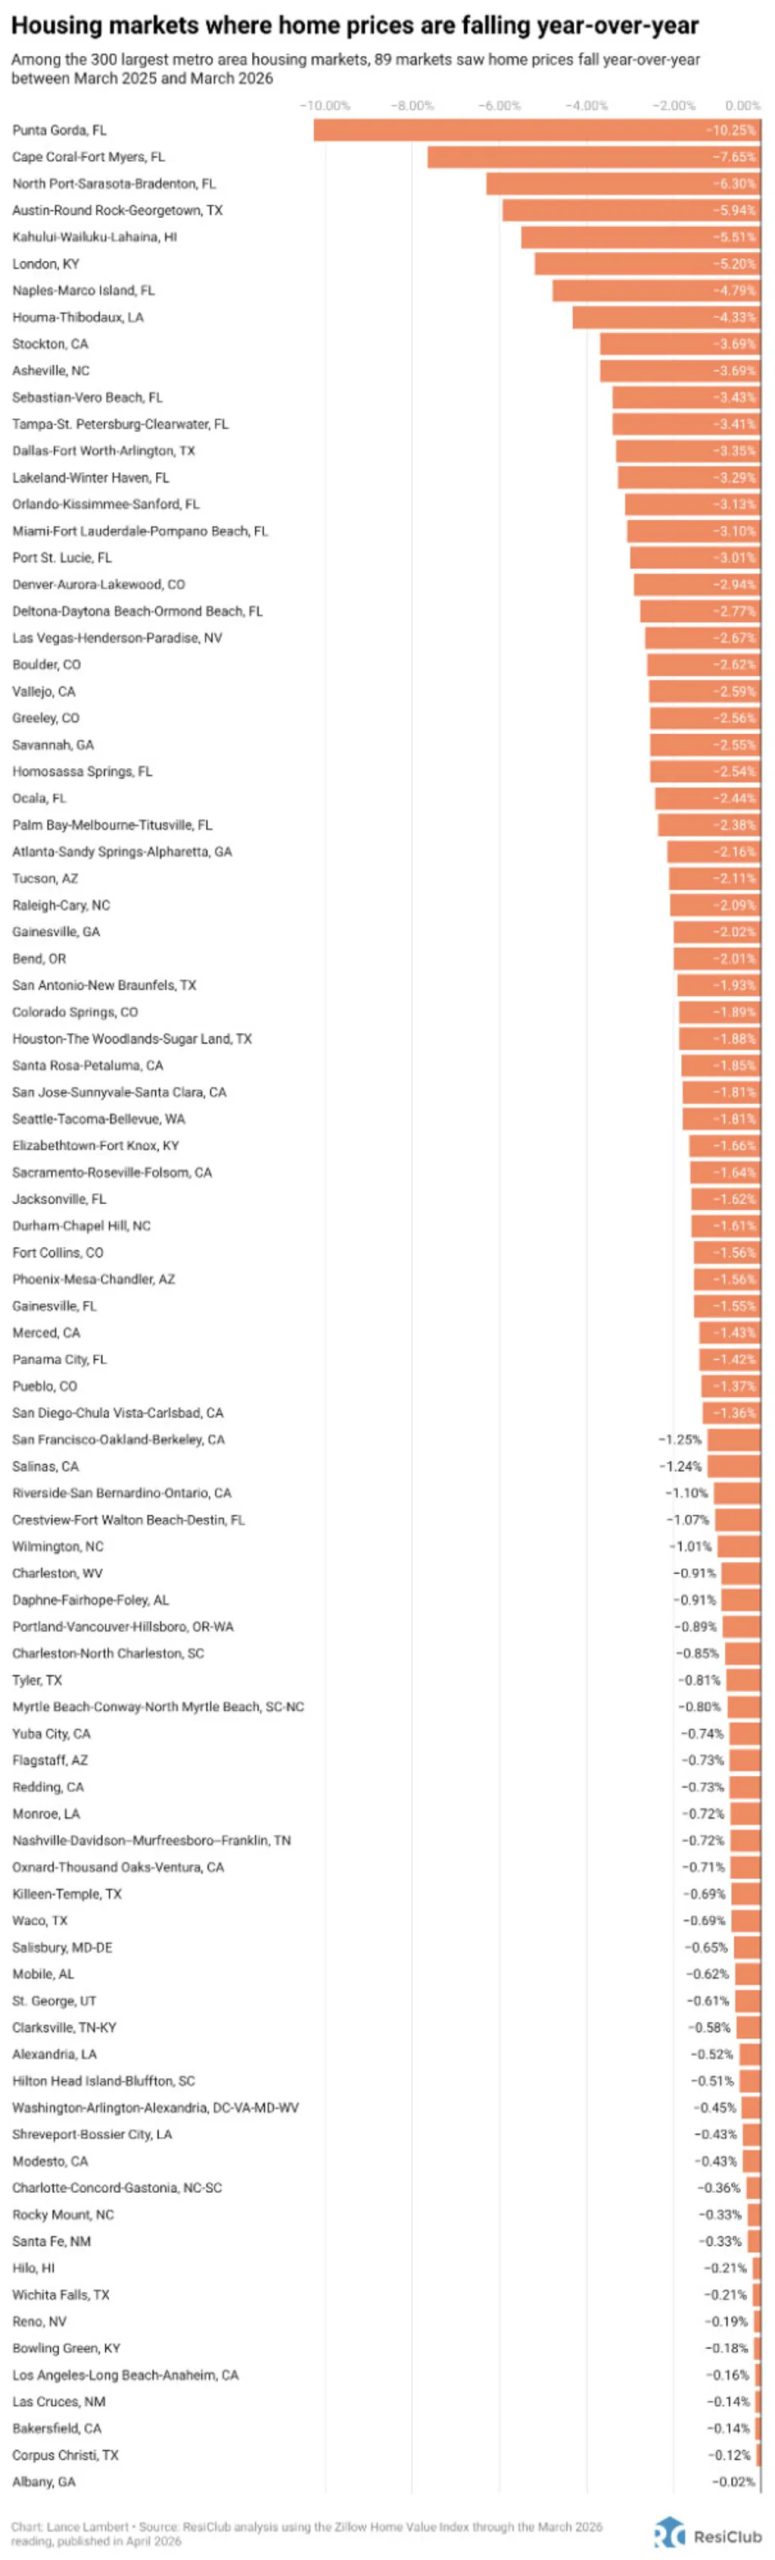
- 89 of the nation’s 300 largest housing markets (i.e., 30% of markets) had a falling year-over-year reading in the March 2025 to March 2026 window.
As you can see above, in the first half of 2025, there was a notable increase in the number of housing markets slipping into year-over-year price declines as the supply–demand equilibrium (as measured by inventory) shifted more quickly toward homebuyers. Over the past eight months, however, the list of declining markets has begun to stabilize and inventory growth has also decelerated.
Based on seasonally adjusted month-over-month prints, ResiClub expects the number of markets with year-over-year price declines to decrease more in the coming months.
Home prices are still climbing a little year-over-year in many regions where active inventory remains well below pre-pandemic 2019 levels, such as pockets of the Northeast and Midwest. In contrast, some pockets in states like Texas, Florida, and Colorado—where active inventory exceeds pre-pandemic 2019 levels by a solid clip—are seeing modest home price pullbacks or flat pricing.
window.addEventListener(“message”,function(a){if(void 0!==a.data[“datawrapper-height”]){var e=document.querySelectorAll(“iframe”);for(var t in a.data[“datawrapper-height”])for(var r,i=0;r=e[i];i++)if(r.contentWindow===a.source){var d=a.data[“datawrapper-height”][t]+”px”;r.style.height=d}}});
Many of the housing markets seeing the most softness, where homebuyers have gained the most leverage, are primarily located in Sun Belt regions, particularly the Gulf Coast and Mountain West.
Many of these areas saw even greater price surges during the Pandemic Housing Boom, with home price growth outpacing local income levels. As pandemic-driven domestic migration slowed and mortgage rates rose in 2022, markets like Tampa and Austin faced challenges, relying on local income levels to support frothy home prices.
That Sun Belt softening was further compounded by an abundance of new home supply in the Sun Belt. Builders are often willing to lower prices or offer affordability incentives to maintain sales, which also has a cooling effect on the resale market. As a result, some buyers who might have previously opted for existing homes are instead choosing new construction with more attractive deals—which added further upward pressure to resale inventory growth over the past few years.
Of course, while 89 of the nation’s 300 largest metro area housing markets are seeing year-over-year home price declines, another 211 are seeing year-over-year home price increases.
Where are home prices still up on a year-over-year basis? See the map below.
window.addEventListener(“message”,function(a){if(void 0!==a.data[“datawrapper-height”]){var e=document.querySelectorAll(“iframe”);for(var t in a.data[“datawrapper-height”])for(var r,i=0;r=e[i];i++)if(r.contentWindow===a.source){var d=a.data[“datawrapper-height”][t]+”px”;r.style.height=d}}});
Below is a historical chart showing the year-over-year change in home prices across the 50 largest metro housing markets, with the yellow line representing the national aggregate, dating back to 2000.
window.addEventListener(“message”,function(a){if(void 0!==a.data[“datawrapper-height”]){var e=document.querySelectorAll(“iframe”);for(var t in a.data[“datawrapper-height”])for(var r,i=0;r=e[i];i++)if(r.contentWindow===a.source){var d=a.data[“datawrapper-height”][t]+”px”;r.style.height=d}}});
While the “range” [see chart above] between the strongest and weakest metro area housing markets right now is fairly normal historically speaking, the “bifurcation” (i.e., direction) itself—the share of markets with rising home prices versus those with falling prices—is wider than normal, given that national appreciation has stabilized into a softer market with growth barely above +0.0%. And the longer some markets remain in the “rising” camp while others stay in the “falling” camp, the wider the gulf can become between the relatively more resilient markets and the weaker ones.
For example, home prices in the Hartford, CT metro area are now +22.5% above their 2022 peak, while home prices in the Austin, TX metro area sit -27.8% below their 2022 peak. Some of that “bifurcation” boils down to mean reversion, with many of the outright home price declines occurring in markets that overheated further during the Pandemic Housing Boom.
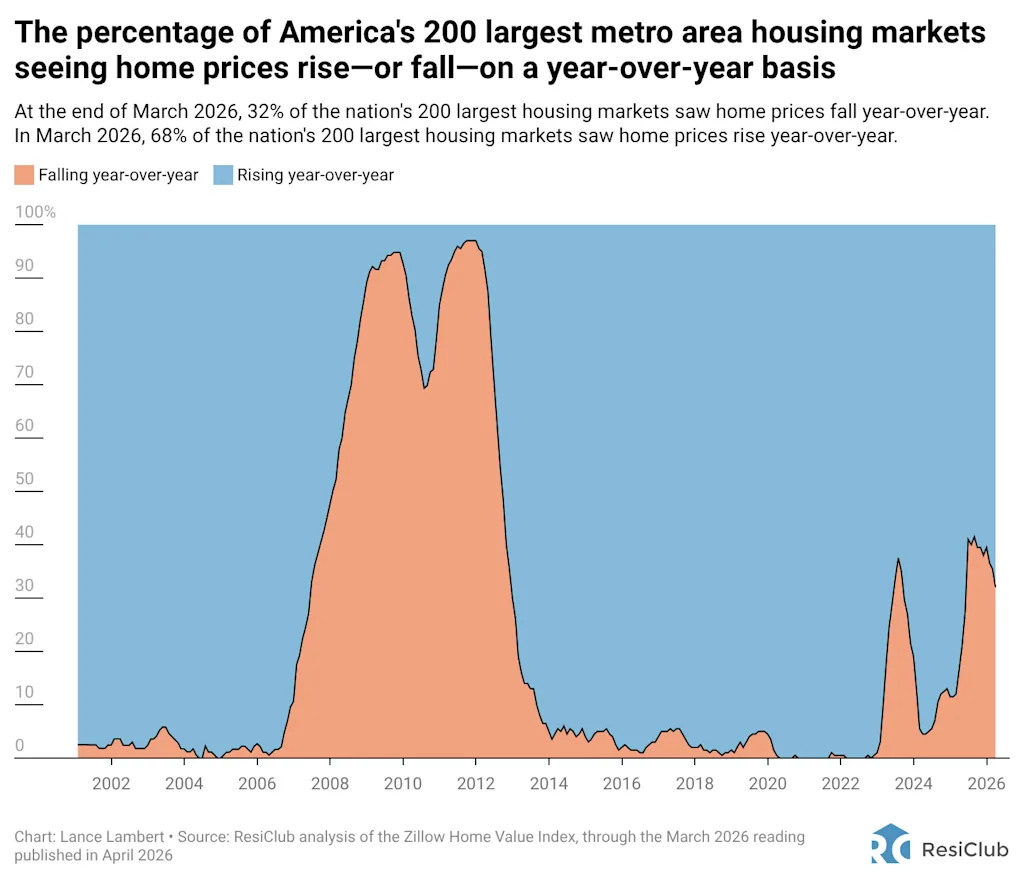
Note: For the historical chart above, we analyzed the 200 largest markets rather than the 300 used above, as some markets ranked 201 to 300 lack complete data going back to 2000. When weighted by population (not visualized), the housing market appears slightly weaker than the chart below suggests—which aligns with the fact that, among just the 50 largest housing markets, 24 (48%) are currently posting negative year-over-year price growth, and nationally aggregated home prices are up just +0.8% year-over-year using the Zillow Home Value Index.