
Close Menu
    Facebook X (Twitter) Instagram
    TRENDING :
    • How ‘Boring’ Businesses Can Win on Black Friday
    • Hoda Kotb Dishes on a ‘Very Handsome’ Flight Encounter
    • He’s Worth $10 Billion. Now He’s Betting on a New AI Startup.
    • Waverly Junior High Soccer Players Celebrate Big Win
    • Top Schools for Entrepreneurs in 2027
    • Bob Boone, Gold Glove Catcher and MLB Family Patriarch, Dies at 78
    • Market Talk – November 10, 2026
    • This Dumpster Diver with Debt Hauled In $140K in 12 Months
    Populist Bulletin
    • Home
    • US Politics
    • World Politics
    • Economy
    • Business
    • Headline News
    Populist Bulletin
    Home»Business»See it: Air temperatures and pollution around the world are captured in real time in these animated weather maps
    Business 3 Mins Read

    See it: Air temperatures and pollution around the world are captured in real time in these animated weather maps

    Business 3 Mins Read
    Share Facebook Twitter Pinterest LinkedIn Tumblr Telegram Email Copy Link
    Follow Us
    Google News Flipboard
    Share
    Facebook Twitter LinkedIn Pinterest Email

    A typical map of temperatures across the planet shows just a snapshot in time, listing the day’s various highs and lows. 

    But temperature isn’t static; it rises and falls, and it’s influenced by all sorts of systems, from ocean currents to solar radiation. 

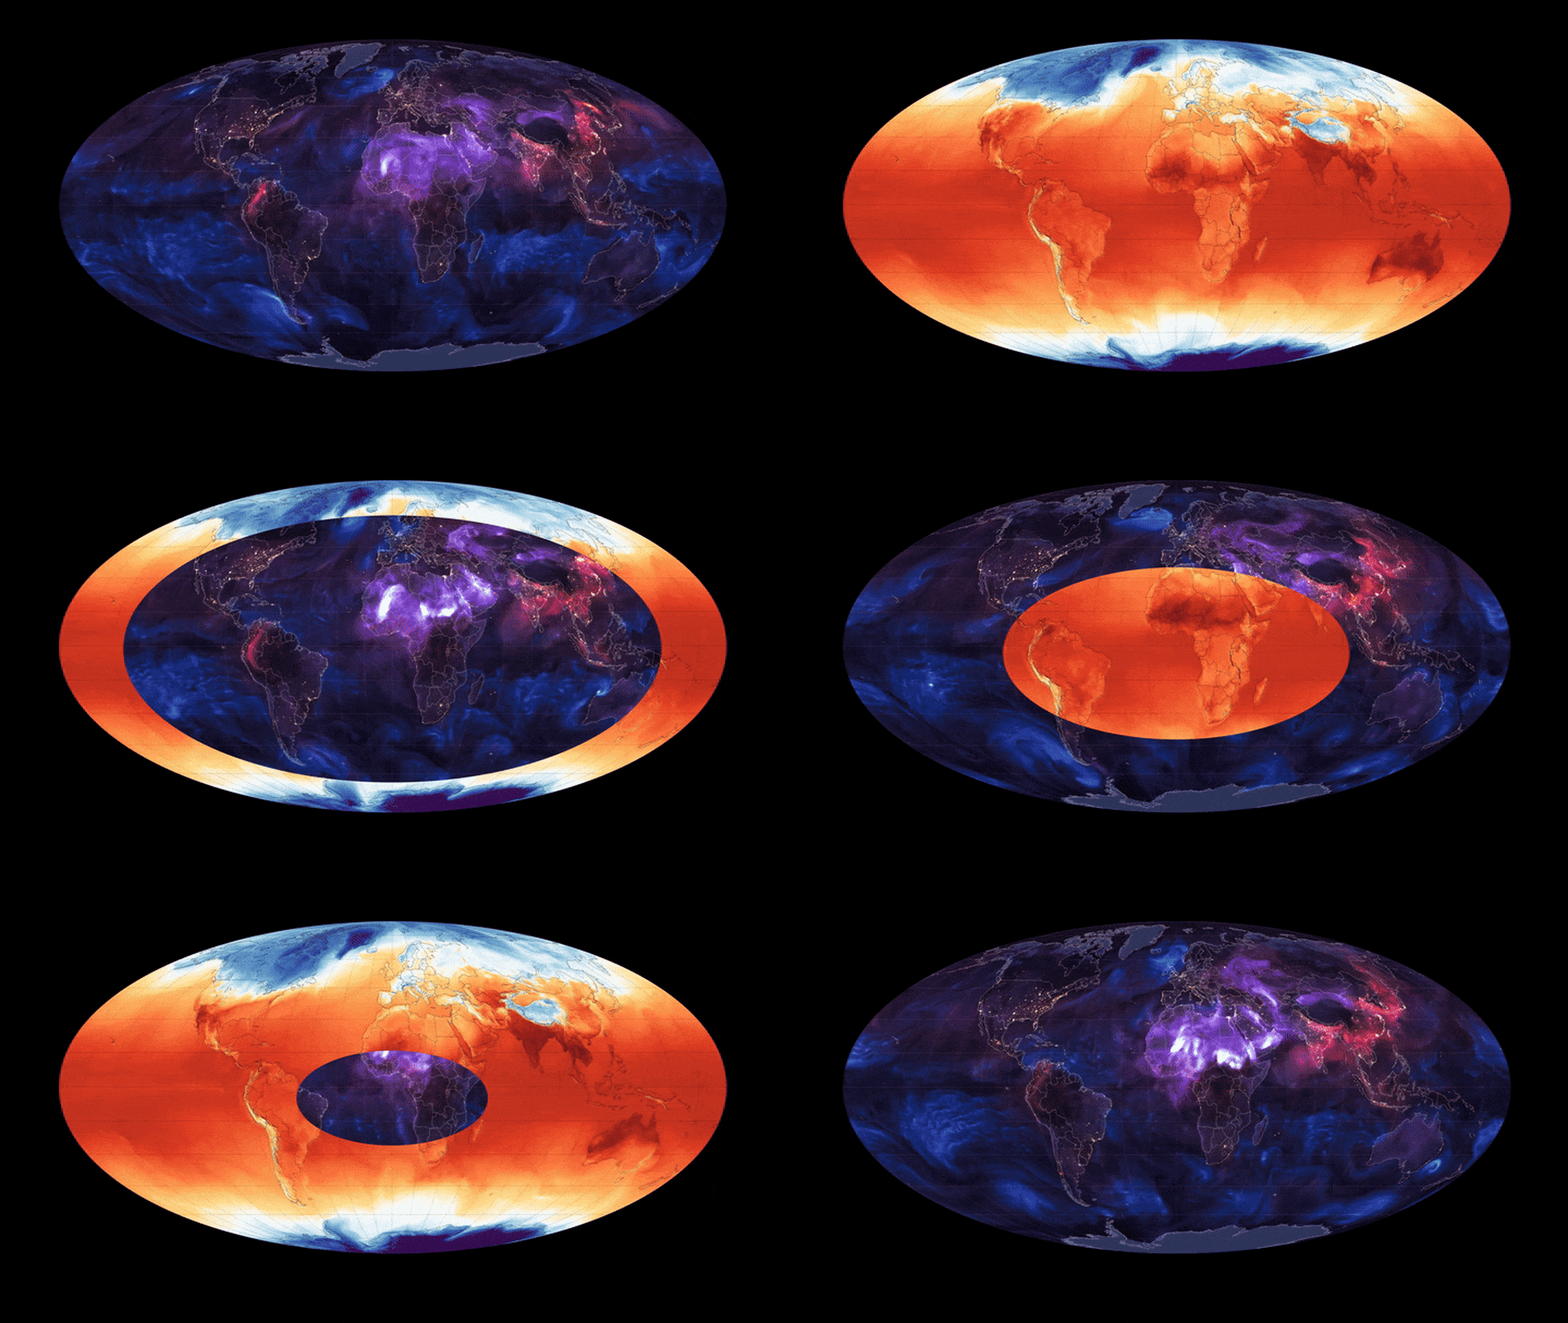
    An animated map from Maps.com shows those variations, revealing the patterns that swirl around our planet—and depicting the gradual way Earth heats up from east to west as the sun rises and sets.

    [Image: Maps.com]

    The animated map is part of a new feature called Earth in Action, through which Maps.com (a platform by spatial analytics company Esri) produces daily, near real-time animated maps about Earth’s systems. 

    “We created Earth in Action to provide a lens into what’s happening on our planet—as it happens,” Maps.com cartographic editor and Earth in Action creator Joshua Stevens says over email. 

    “Whether it’s something typical, like the current air temperature, or an extreme event like a major dust storm, we wanted to provide an opportunity for people to see them,” he adds.

    By turning static data into moving animations, the maps reveal how interconnected Earth is, and how what happens on one part of the planet can influence another.

    “It’s one thing to tell someone that dust from the Sahara helps fertilize the soils of the Amazon rainforest,” Stevens says. “It’s another thing to show that actually happening, as dust is lofted from Africa and carried across the Atlantic Ocean. … What happens here today influences other locations later.”

    [Image: Maps.com]

    That dust is depicted on the aerosols map, seen in swirls of purple that whirl above Africa and then float across the planet’s surface.

    The aerosols map also shows the movement of black carbon, a dangerous pollution released by the combustion of fossil fuels, trees, and other organic materials; as well as sea salt, which enters the atmosphere via crashing waves and ocean winds, and can affect the formation of clouds and rain. 

    The movement of these aerosol particles “can reveal everything from wildfires to hurricanes,” Stevens says. The moving data can reveal how Earth’s climate systems transport that smoke, and how hurricanes move over oceans.

    The animated maps, which show such activity over seven days, add context to these events, revealing how they emerge, evolve, and affect other locations. 

    Currently, Earth in Action only produces maps about temperature and aerosols; the platform plans to add maps about rain and snowfall, active wildfires, sea ice and sea surface temperatures, the ozone hole, and more in the future.

    Through this feature, Stevens hopes these scientific observations of Earth become more accessible to people, no matter their scientific background or level of expertise. He encourages people to check back throughout the year and see how these systems change across seasons.

    “Earth in Action is more than animated maps,” he says. “It’s a view into scientific datasets that few people know how to access, let alone process or communicate with others.”


    Source link

    Share. Facebook Twitter Pinterest LinkedIn Tumblr Email

    Related Posts

    How ‘Boring’ Businesses Can Win on Black Friday

    November 10, 2026

    He’s Worth $10 Billion. Now He’s Betting on a New AI Startup.

    November 10, 2026

    Top Schools for Entrepreneurs in 2027

    November 10, 2026
    Top News
    US Politics 7 Mins Read

    How Stephen Miller Became the Power Behind the Throne

    US Politics 7 Mins Read

    Cultural Contradictions / February 10, 2026 Miller was not elected. Nor are he or his…

    Area High School Teams Battle for Playoff Positioning

    September 24, 2026

    Managers are bad at coaching: 4 tips for improving

    August 30, 2026

    The Plot That Could Have Deranged America

    October 10, 2025
    Top Trending
    Business 12 Mins Read

    How ‘Boring’ Businesses Can Win on Black Friday

    Business 12 Mins Read

    Opinions expressed by Entrepreneur contributors are their own. Key Takeaways Send handwritten…

    World Politics 1 Min Read

    Hoda Kotb Dishes on a ‘Very Handsome’ Flight Encounter

    World Politics 1 Min Read

    Hoda Kotb is spilling the tea on a chance meeting that has…

    Business 4 Mins Read

    He’s Worth $10 Billion. Now He’s Betting on a New AI Startup.

    Business 4 Mins Read

    Key Takeaways Vinod Khosla, 71, is betting AI can replace one-size-fits-all websites…

    Categories
    • Business
    • Economy
    • Headline News
    • Top News
    • US Politics
    • World Politics
    About us

    The Populist Bulletin was founded with a fervent commitment to inform, inspire, empower and spark meaningful conversations about the economy, business, politics, government accountability, globalization, and the preservation of American cultural heritage.

    We are devoted to delivering straightforward, unfiltered, compelling, relatable stories that resonate with the majority of the American public, while boldly challenging false mainstream narratives that seem to only serve entrenched elitists, and foreign interests.

    Top Picks

    How ‘Boring’ Businesses Can Win on Black Friday

    November 10, 2026

    Hoda Kotb Dishes on a ‘Very Handsome’ Flight Encounter

    November 10, 2026

    He’s Worth $10 Billion. Now He’s Betting on a New AI Startup.

    November 10, 2026
    Categories
    • Business
    • Economy
    • Headline News
    • Top News
    • US Politics
    • World Politics
    Copyright © 2025 Populist Bulletin. All Rights Reserved.

    Type above and press Enter to search. Press Esc to cancel.